Performance optimization in Unity is one of those topics where experienced developers and beginners give completely different advice. Beginners reach for the obvious things, reduce polygon count, compress textures. Experienced developers know those rarely matter.
Here’s what I’ve learned shipping mobile games at Gameloft and Zynga.
Profile first. Always.
The single most common mistake is optimizing based on intuition rather than data. Unity’s Profiler and Frame Debugger will consistently surprise you. The frame drop you assumed was GPU-bound turns out to be a GC allocation spike. The “expensive” particle system is fine; the innocent-looking script doing a FindObjectOfType every frame is killing you.
Before touching a line of code: profile on device. Not in the editor. The editor introduces its own overhead and lies to you about relative costs.
The real culprits on mobile
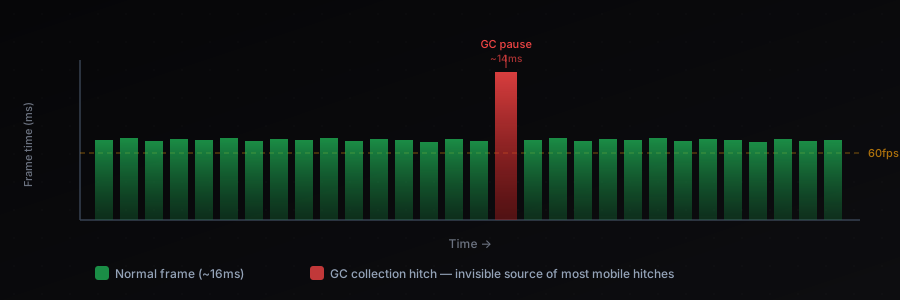
Garbage collection pauses are the most common source of hitches on mobile. Unlike desktop, mobile runtimes do less background GC work, so allocations pile up and the eventual collection causes a visible freeze.
Common allocation sources that are easy to miss:
stringconcatenation in hot paths (useStringBuilderor interpolation carefully)- LINQ in update loops (allocates enumerators)
GetComponent<T>(), cache it inAwake, notUpdateCamera.main, it callsFindObjectOfTypeinternally every time
Draw calls still matter on mobile, but batching solves most of it. Static batching for environment geometry, GPU instancing for repeated objects, and atlasing UI sprites into a single canvas. The key insight: it’s not the polygon count that costs you, it’s the number of state changes the GPU has to process.
Physics is almost always over-specified. Most games don’t need the default fixed timestep of 0.02s. Bumping to 0.03s reduces physics CPU time by 33% with no perceptible gameplay difference for most genres. Also: use FixedUpdate only for physics, never for game logic.
Texture memory is the silent killer
On iOS especially, running out of memory means an instant process kill, no warning, no crash log in most cases. Texture atlases help with draw calls but they have a nasty side effect: they keep more textures resident in memory simultaneously.
The optimization that consistently delivers the most: texture compression formats matched to the platform. ASTC for iOS Metal, ETC2 for Android. These are hardware-decoded and use a fraction of the memory of uncompressed RGBA32. A 1024×1024 RGBA32 texture is 4MB. The same texture as ASTC 6×6 is ~180KB.
Script architecture matters more than micro-optimizations
The biggest performance wins I’ve seen come from architecture changes, not micro-optimizations:
- Moving from
MonoBehaviourupdate loops to an ECS-style update manager that ticks all entities in a single loop eliminates the C++/C# interop overhead of Unity calling hundreds of individualUpdate()methods - Object pooling for anything spawned and destroyed frequently, bullets, particles, UI notifications
- Level of Detail (LOD) on everything, not just 3D models, script update frequency, physics collider complexity, audio source distance curves
The 1% micro-optimizations (avoid Debug.Log, cache transform, etc.) are table stakes. The architectural decisions are what separates a 30fps game from a 60fps one.